Data Visualization
Celebrating Uber’s Data-Rich Culture
Client
Uber
Challenge
On the heels of Uber’s global return to work, new hires and organizational change, and substantive business strategy shifts, their brand and HR leadership was eager to align the enterprise around a newly defined suite of cultural values–all driven by global platform data and employee insights.
Opportunity
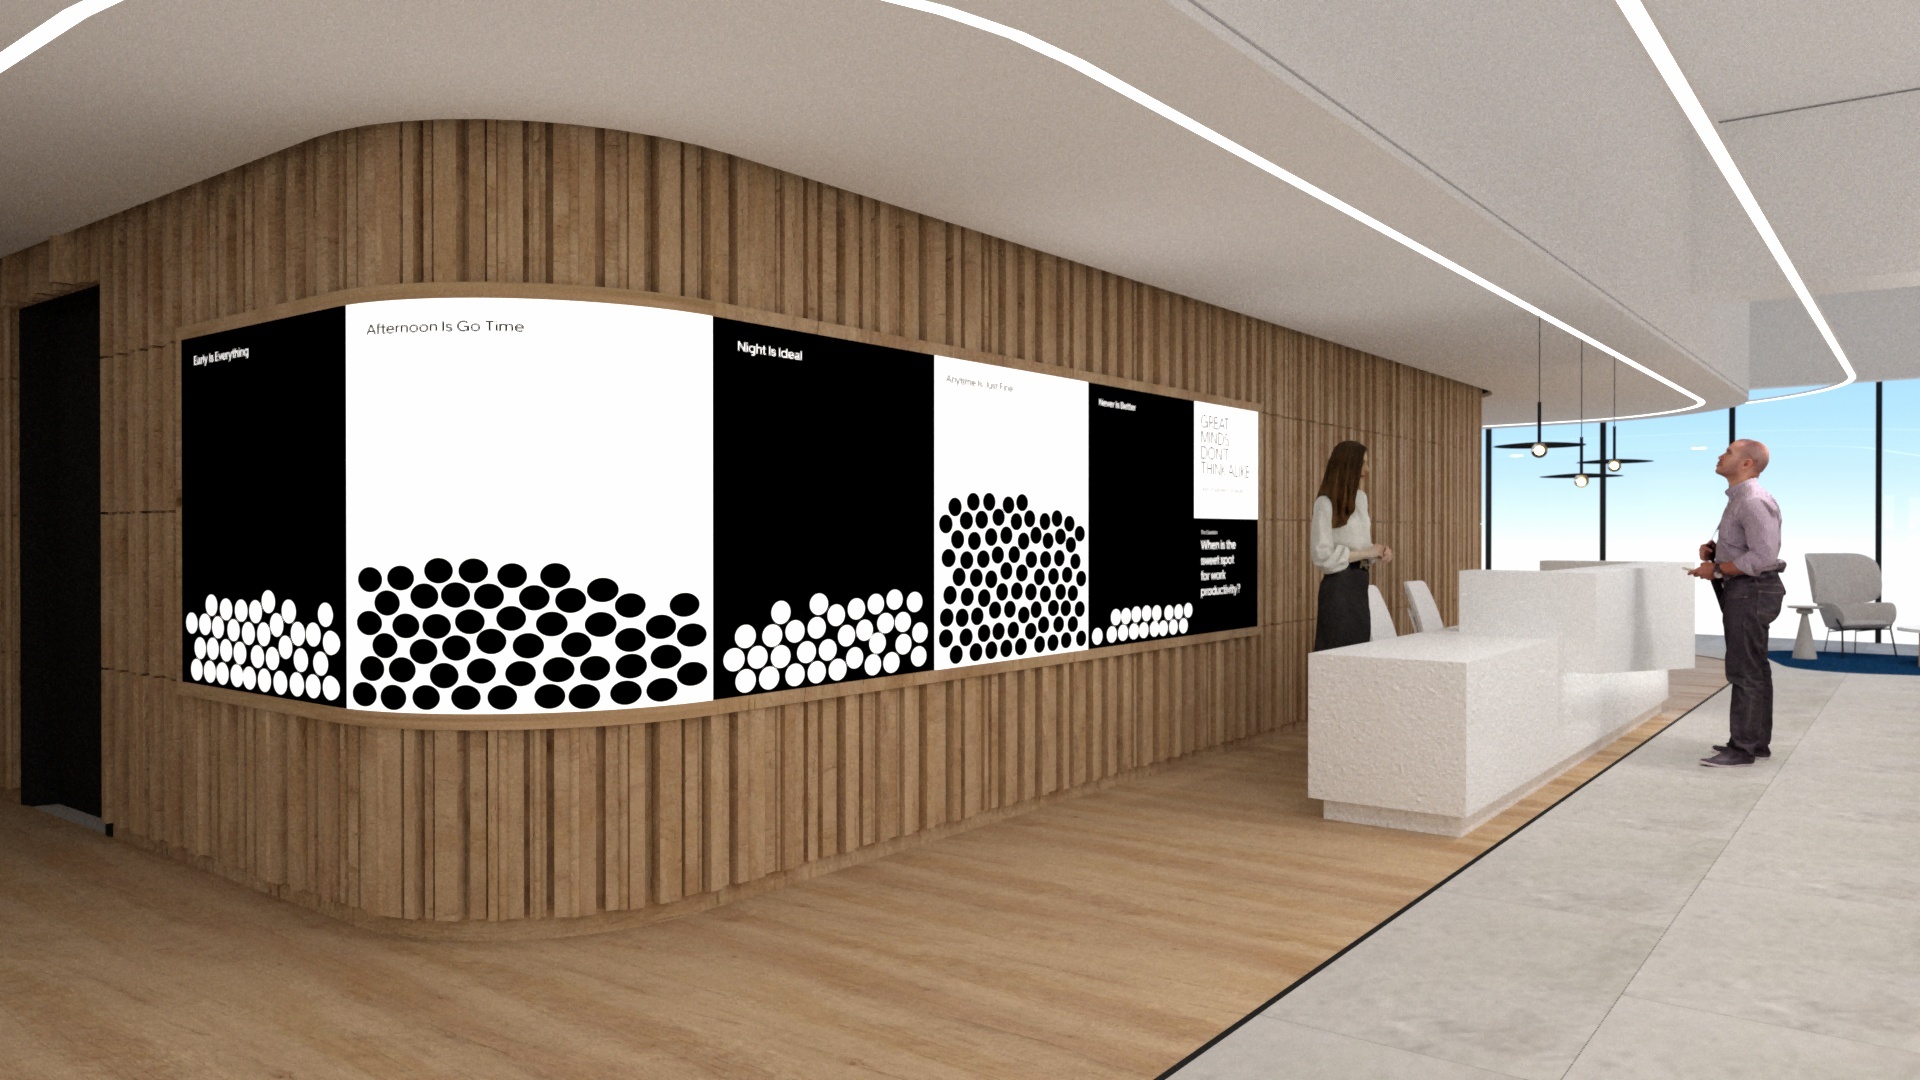
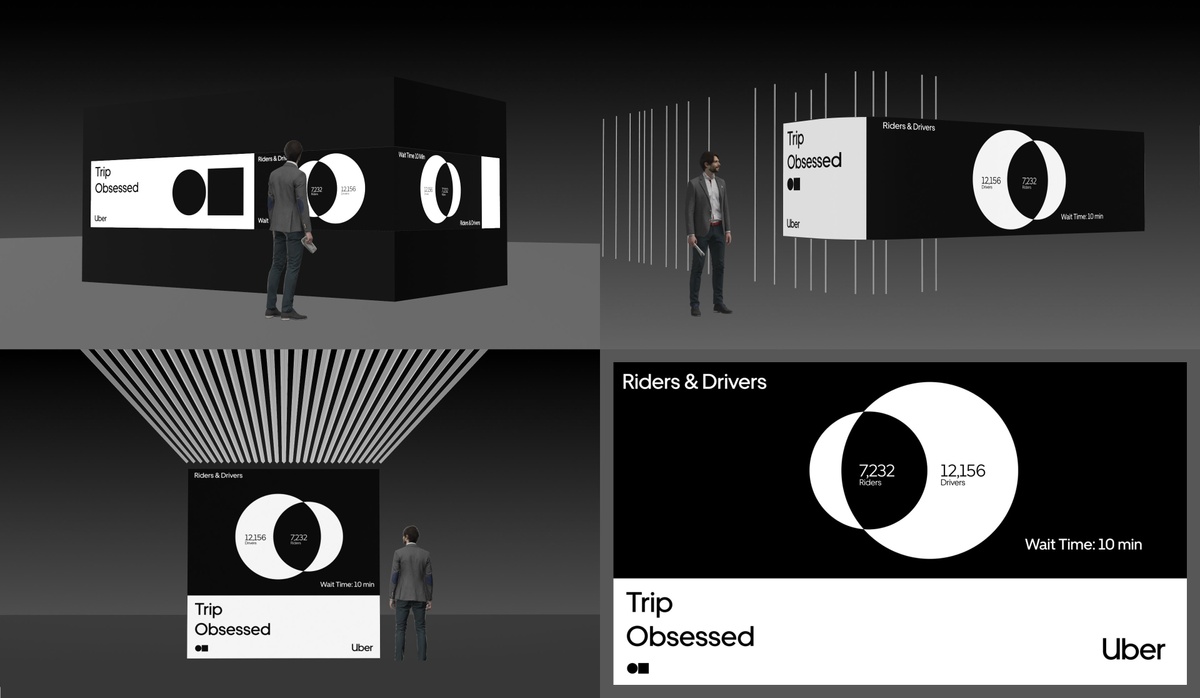
Articulate Uber’s cultural values with a suite of branded, data-driven, digital content that can occupy nearly every media surface throughout Uber’s global workplaces and employee digital platforms. Optimize this data-centric storytelling for impact at every scale and programmatic need, including The Stream experience at the Mission Bay HQ.
Audience Impact
# of Cultural Stories
4
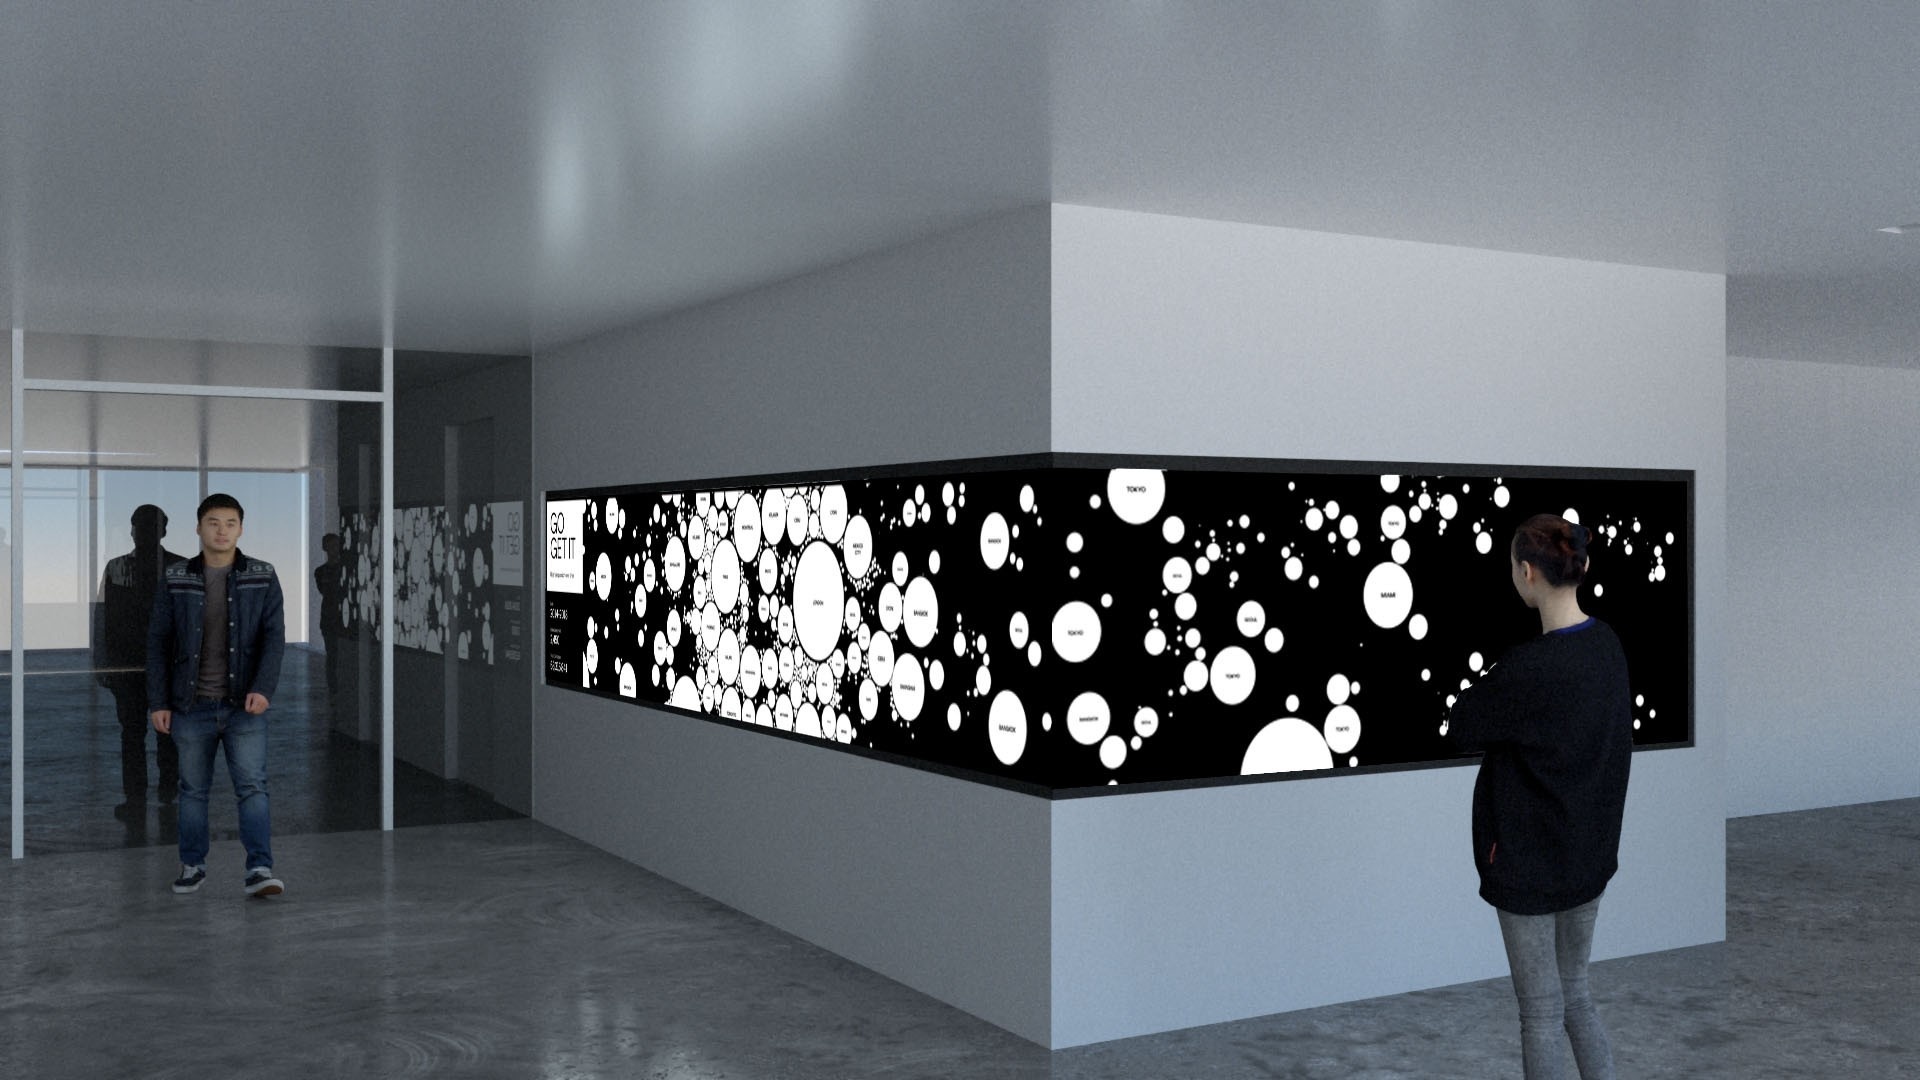
Spatial Impact
Content Visibility
4 Global Locations
Global Impact
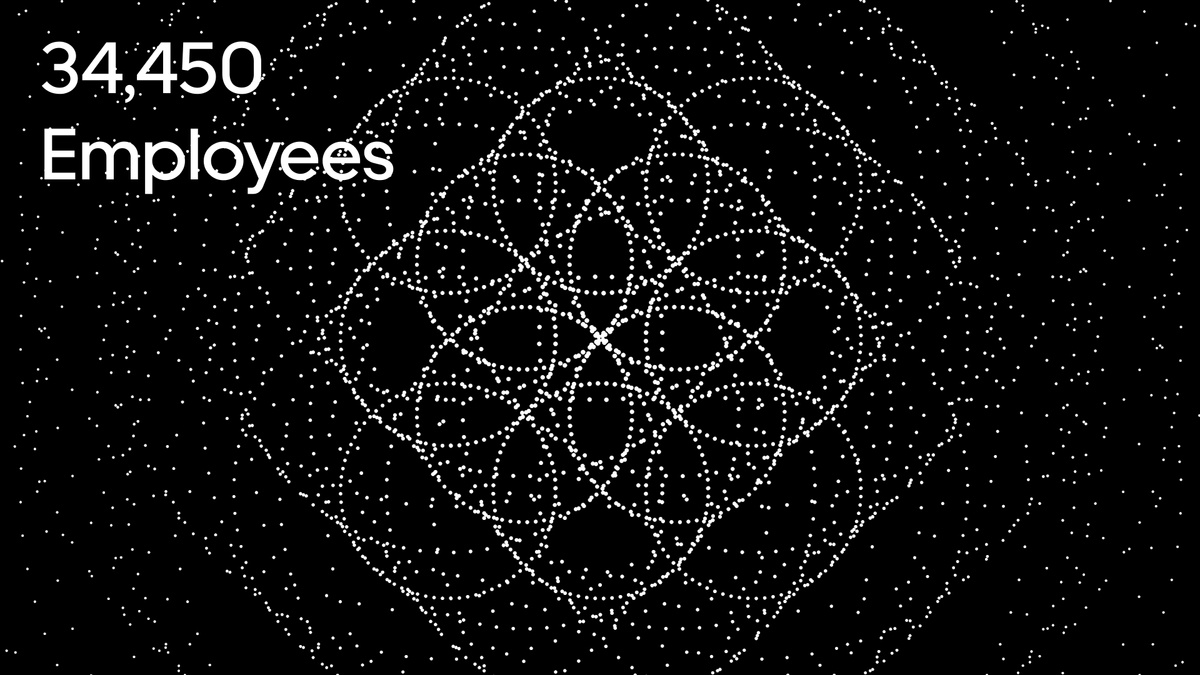
Company Size
29,300 FTEs

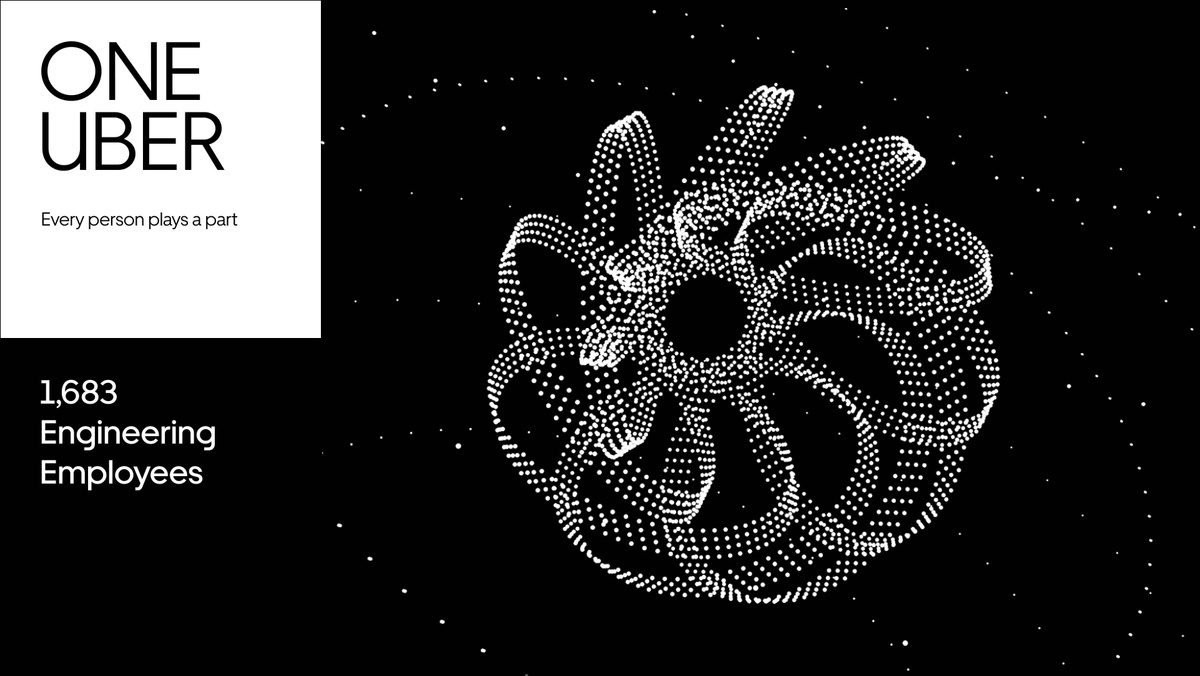
Unlocking Culture Through Data
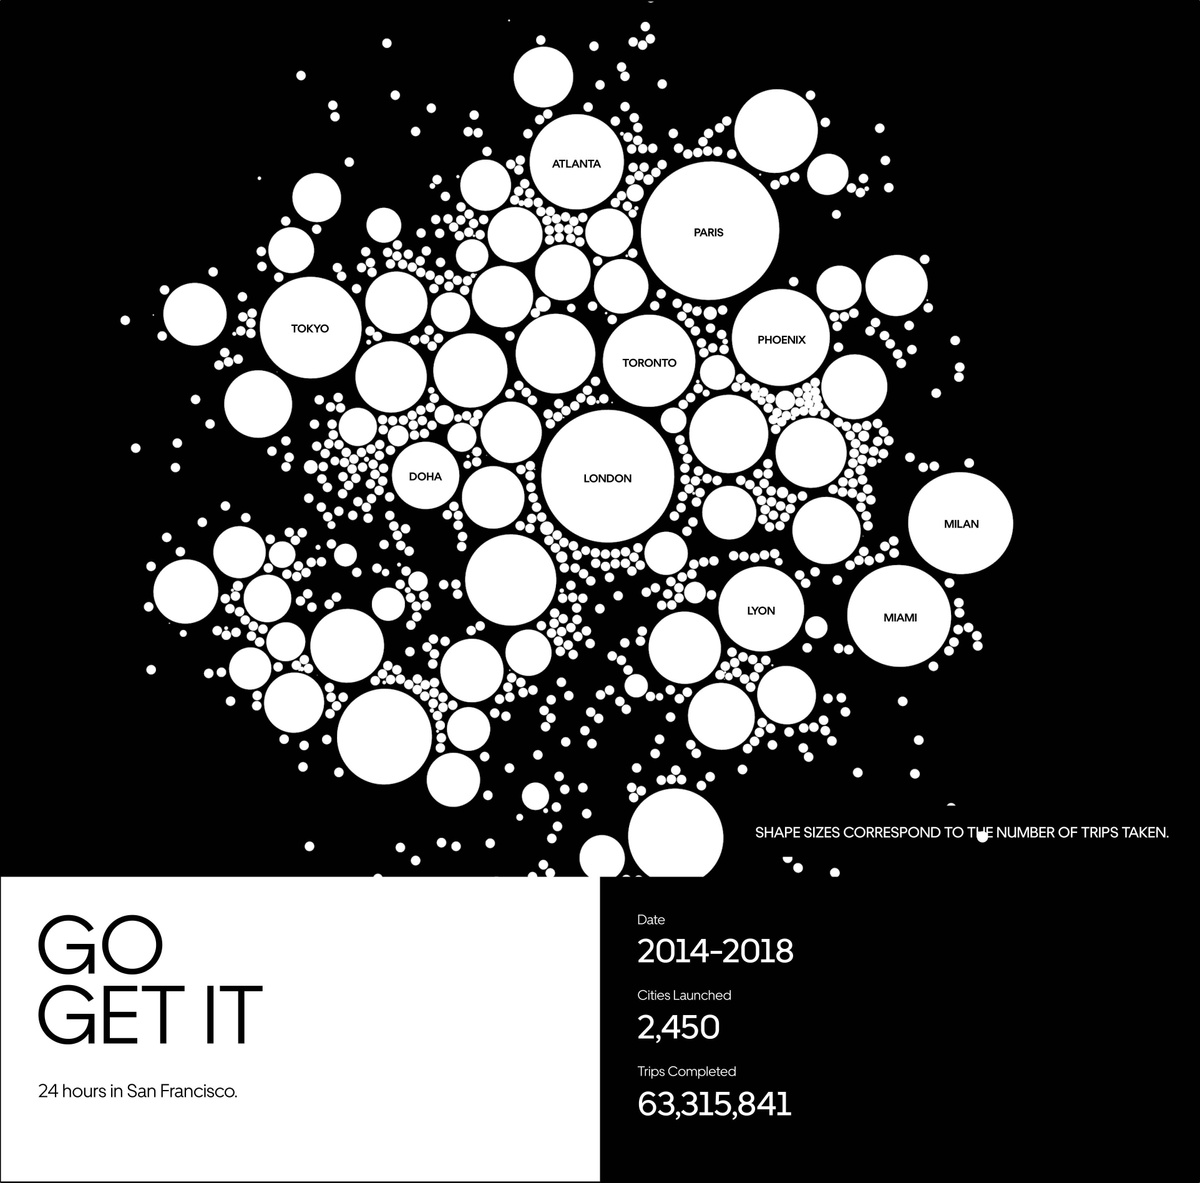
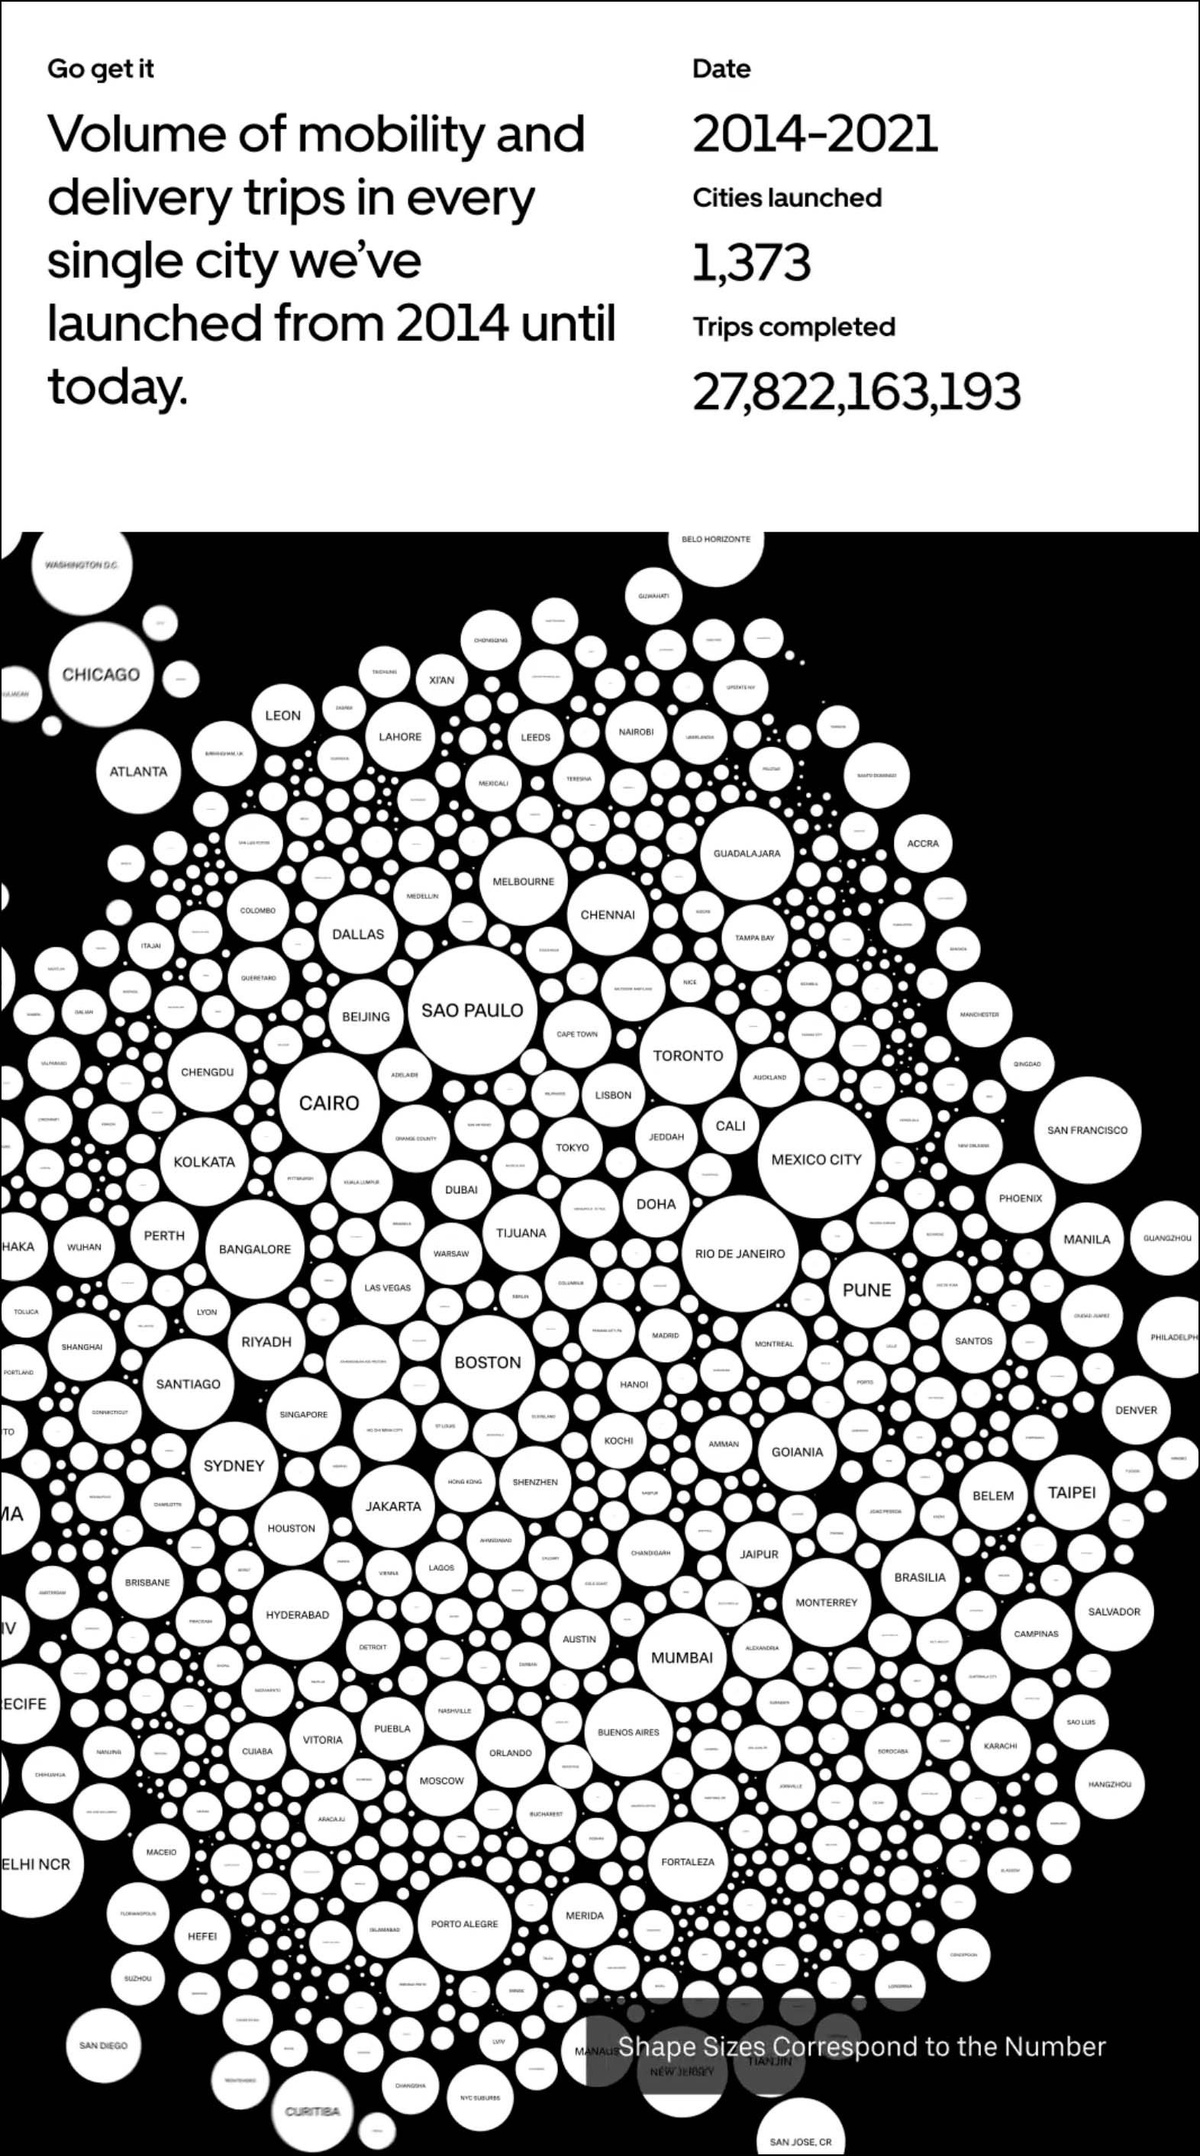
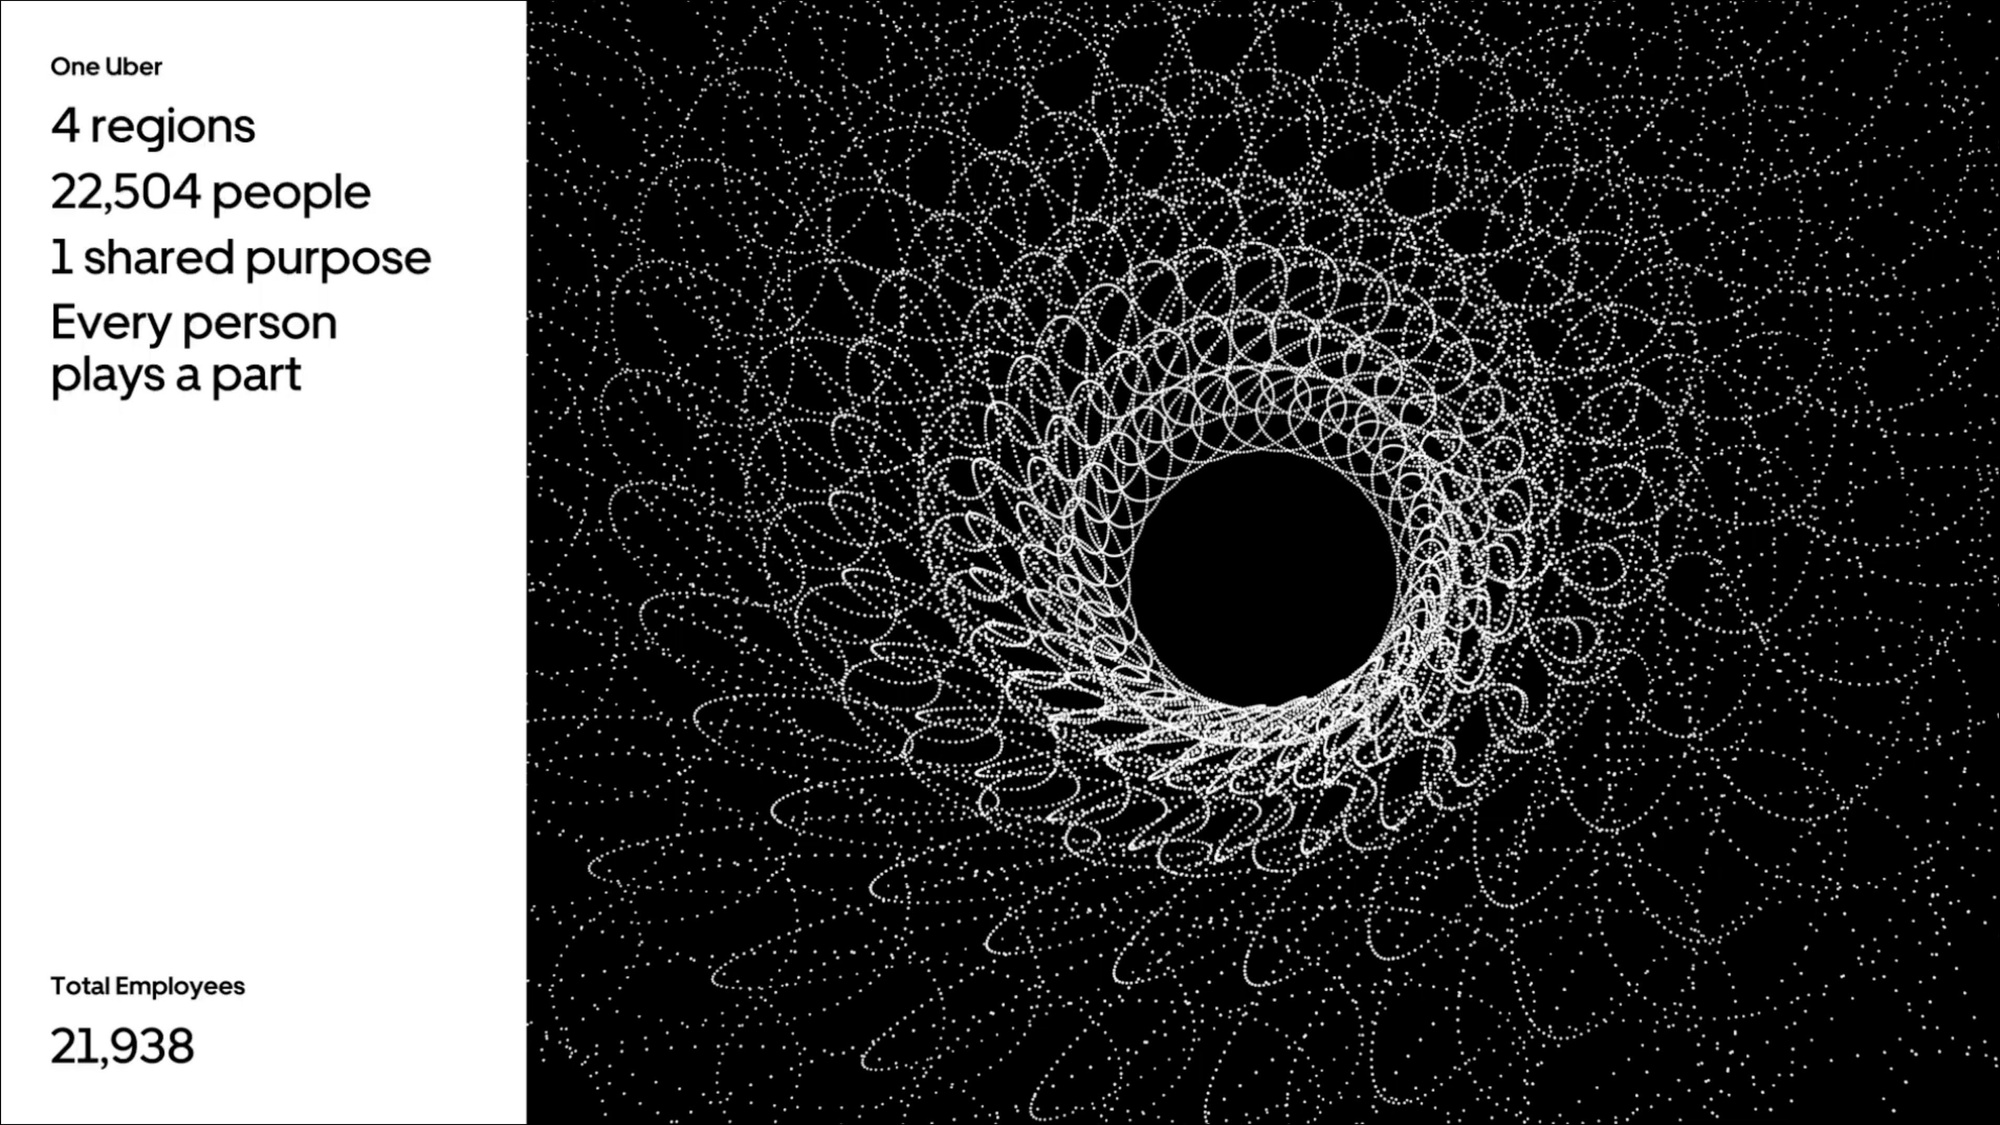
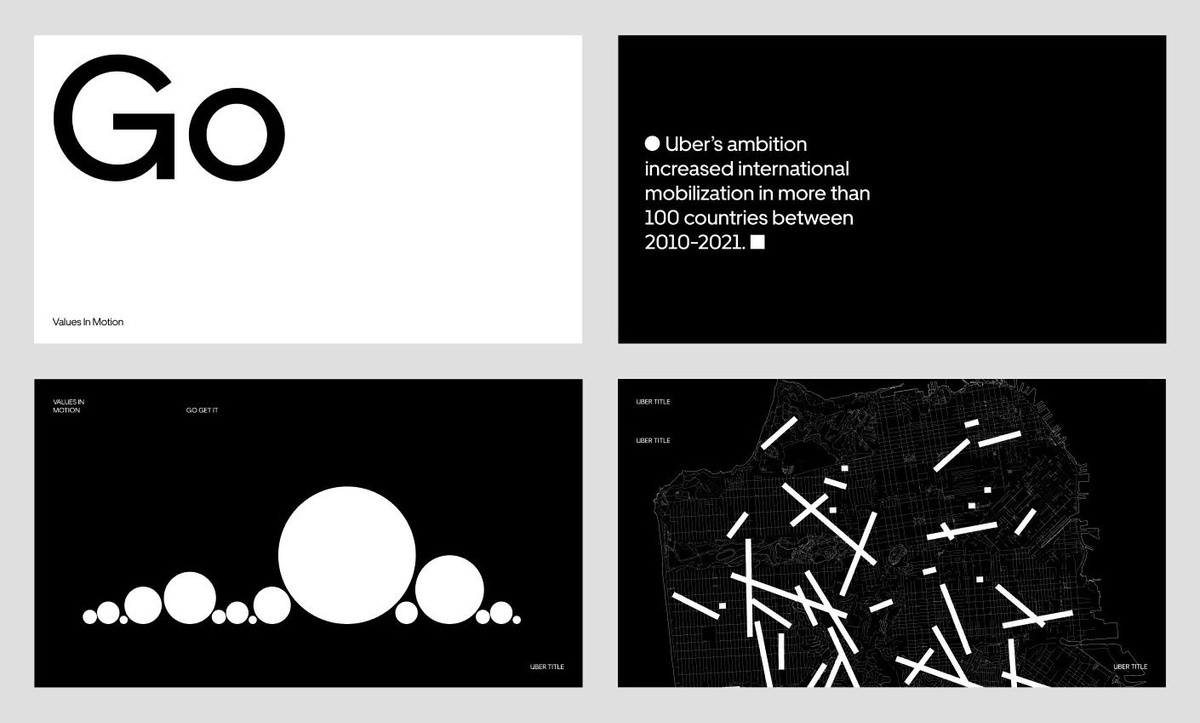
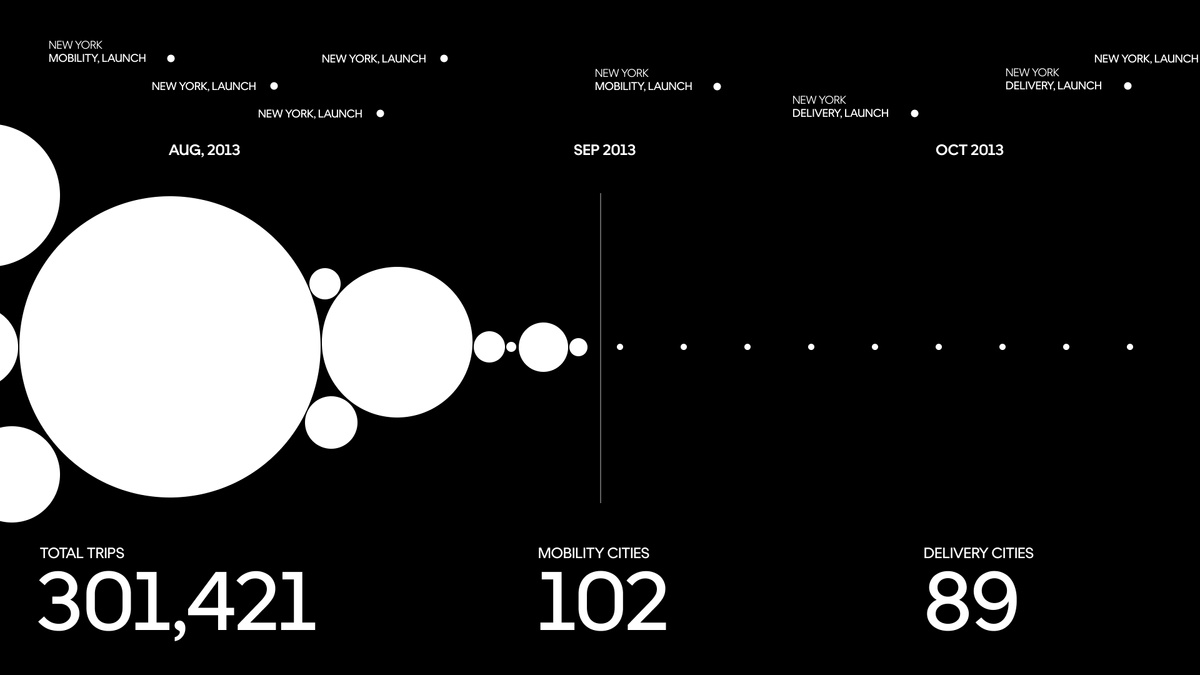
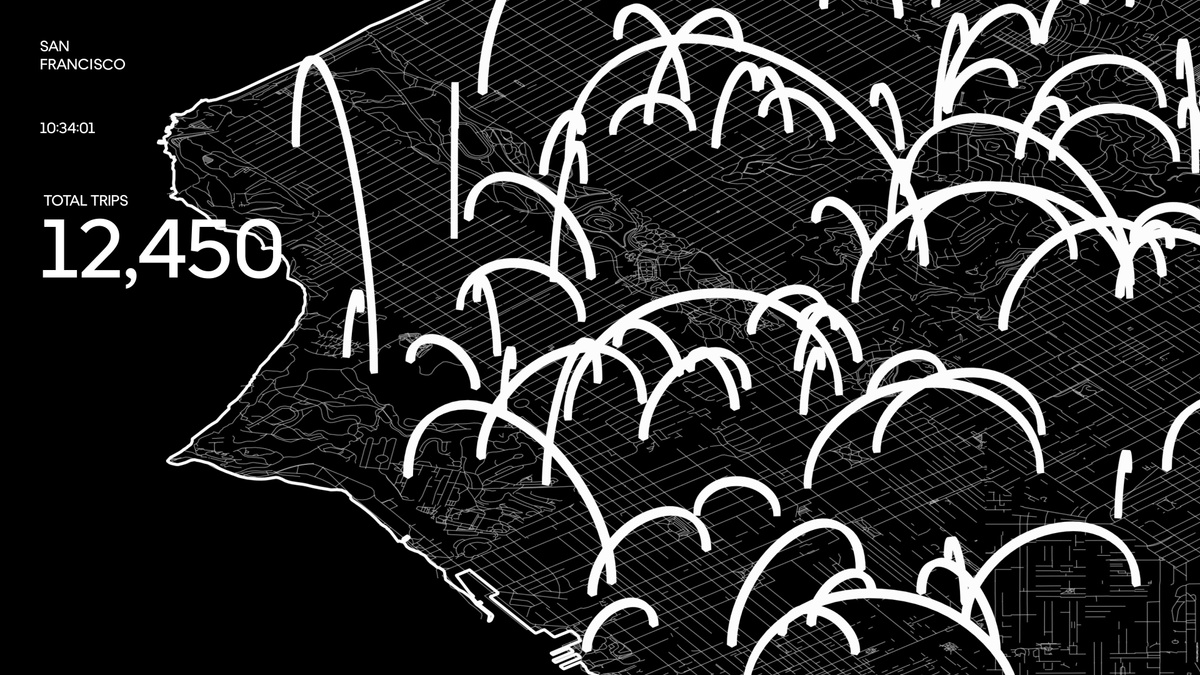
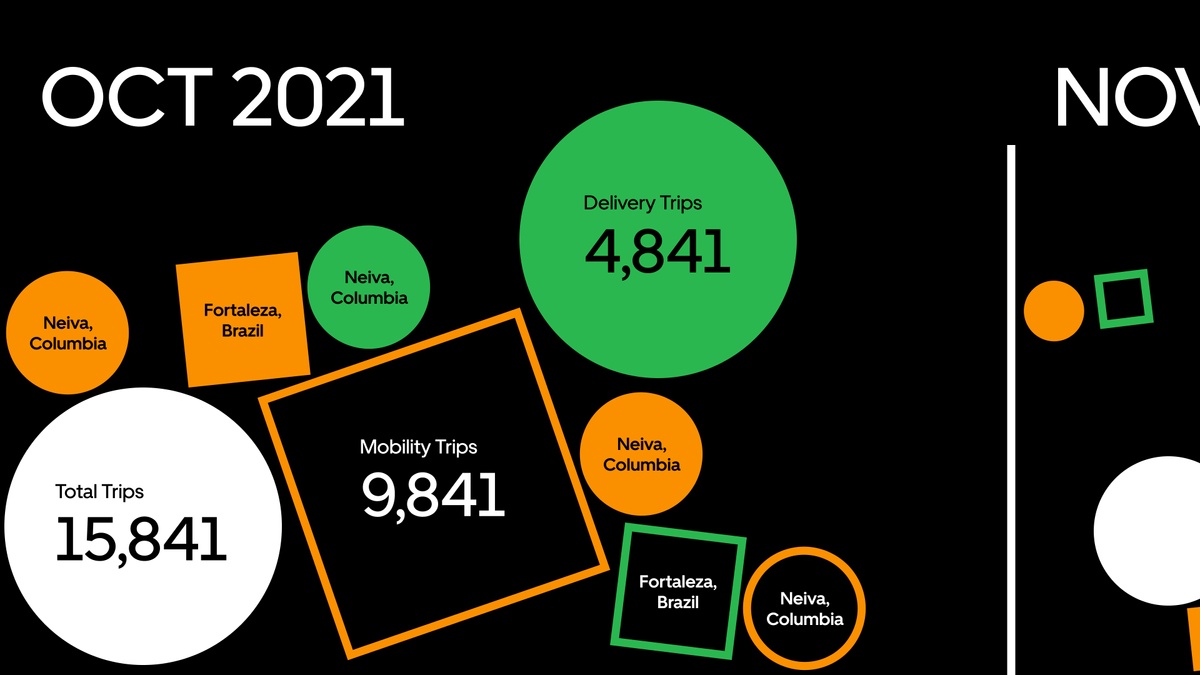
We set out to help Uber employees see how their day to day work directly connects to Uber’s core values. Physics-based data visualizations ground Uber’s core values in real data points that evolve over time and connect employees to their participation in the global business mission.

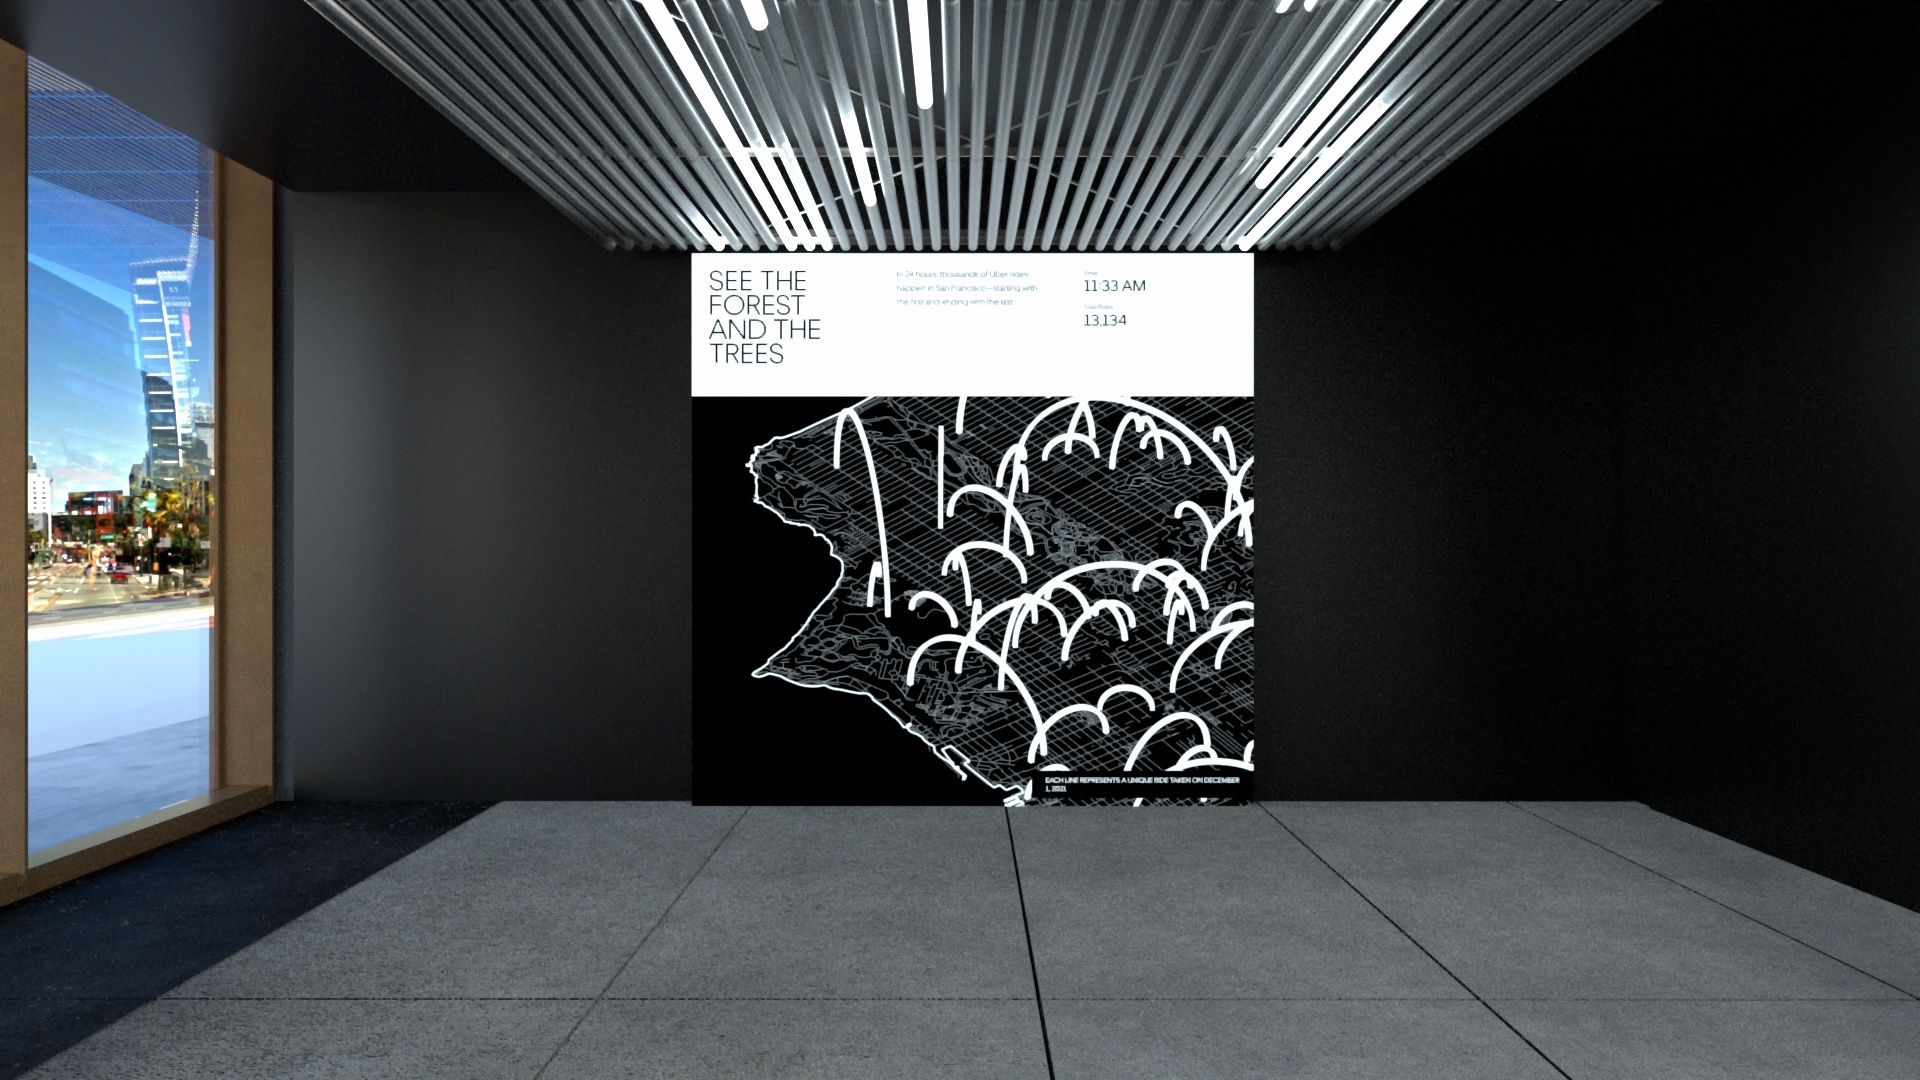
Using Data-Driven Expressions to Extend the Brand System
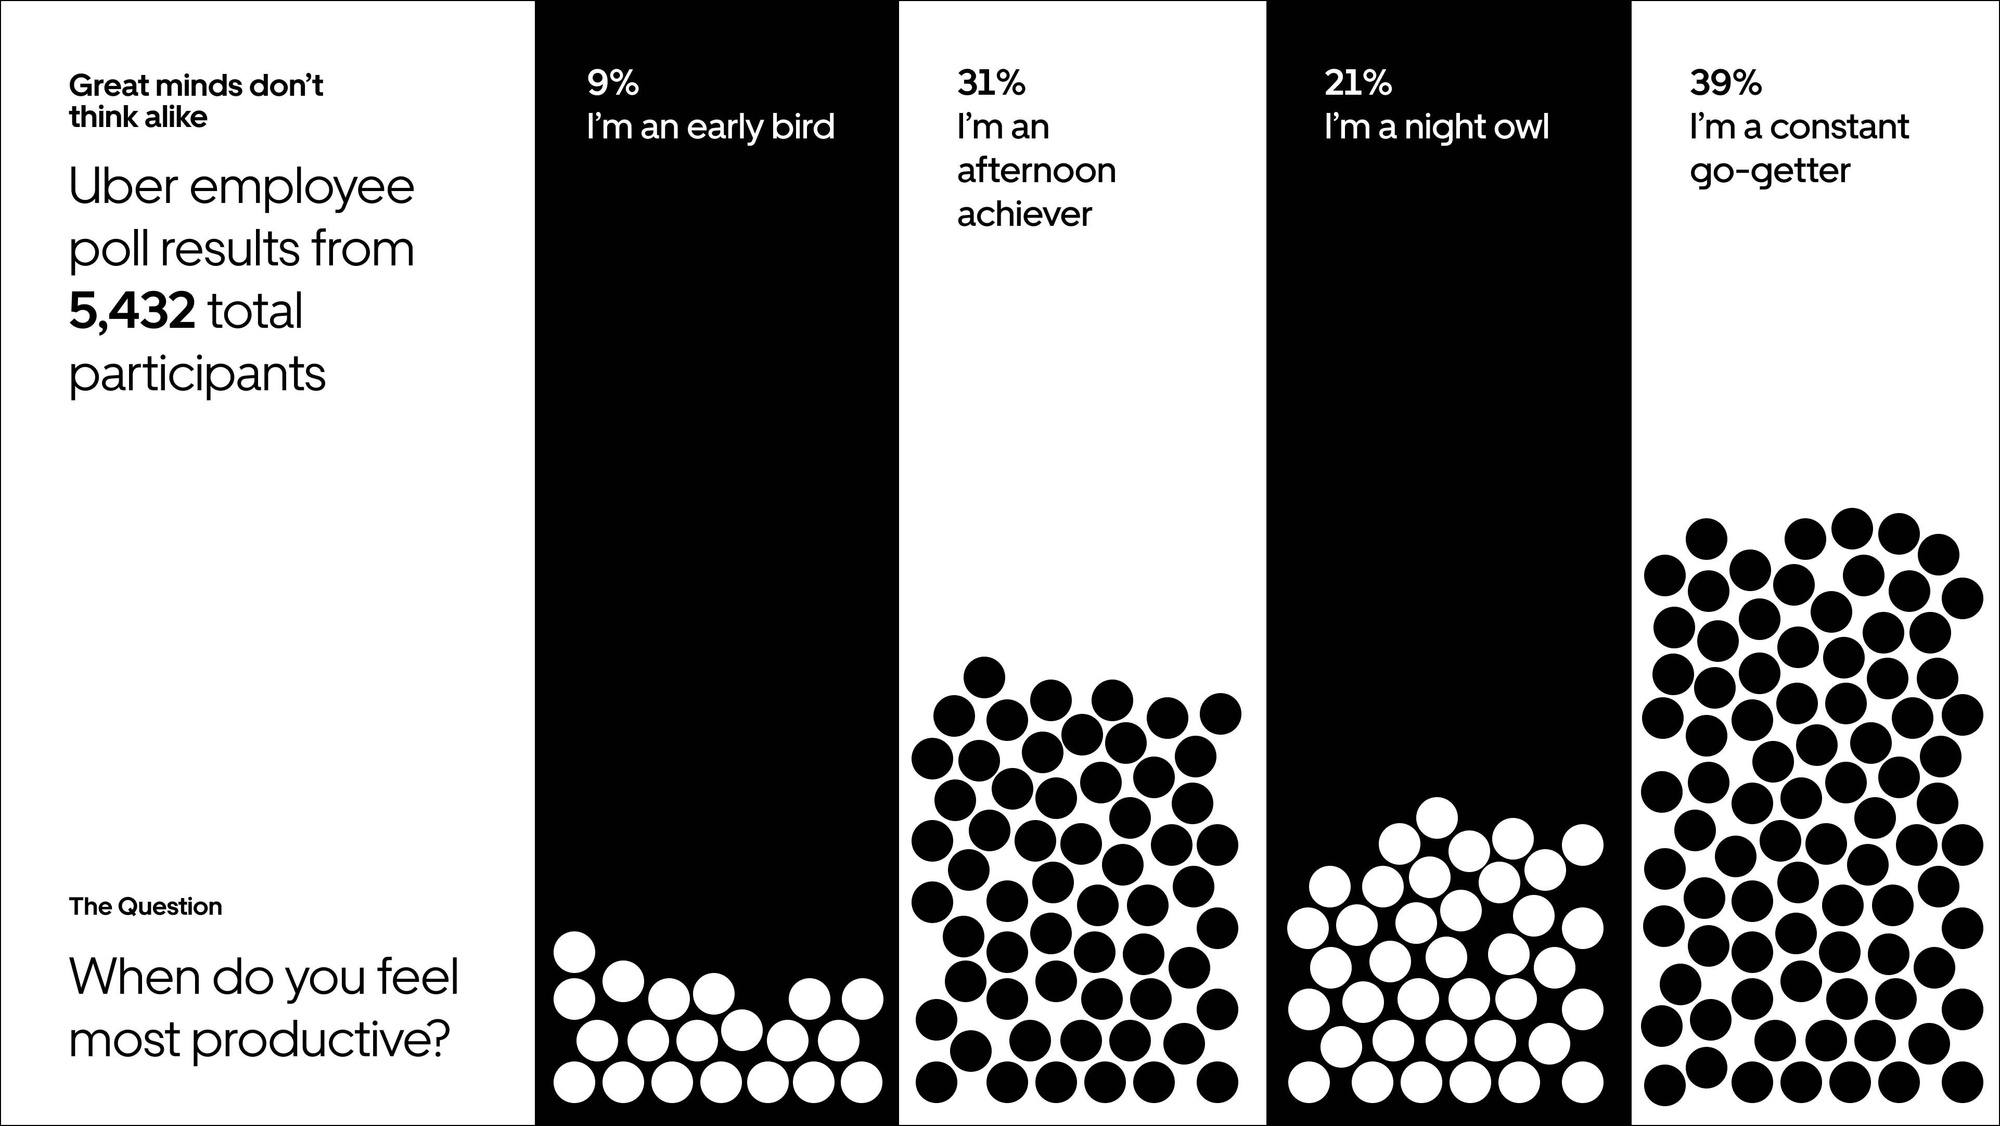
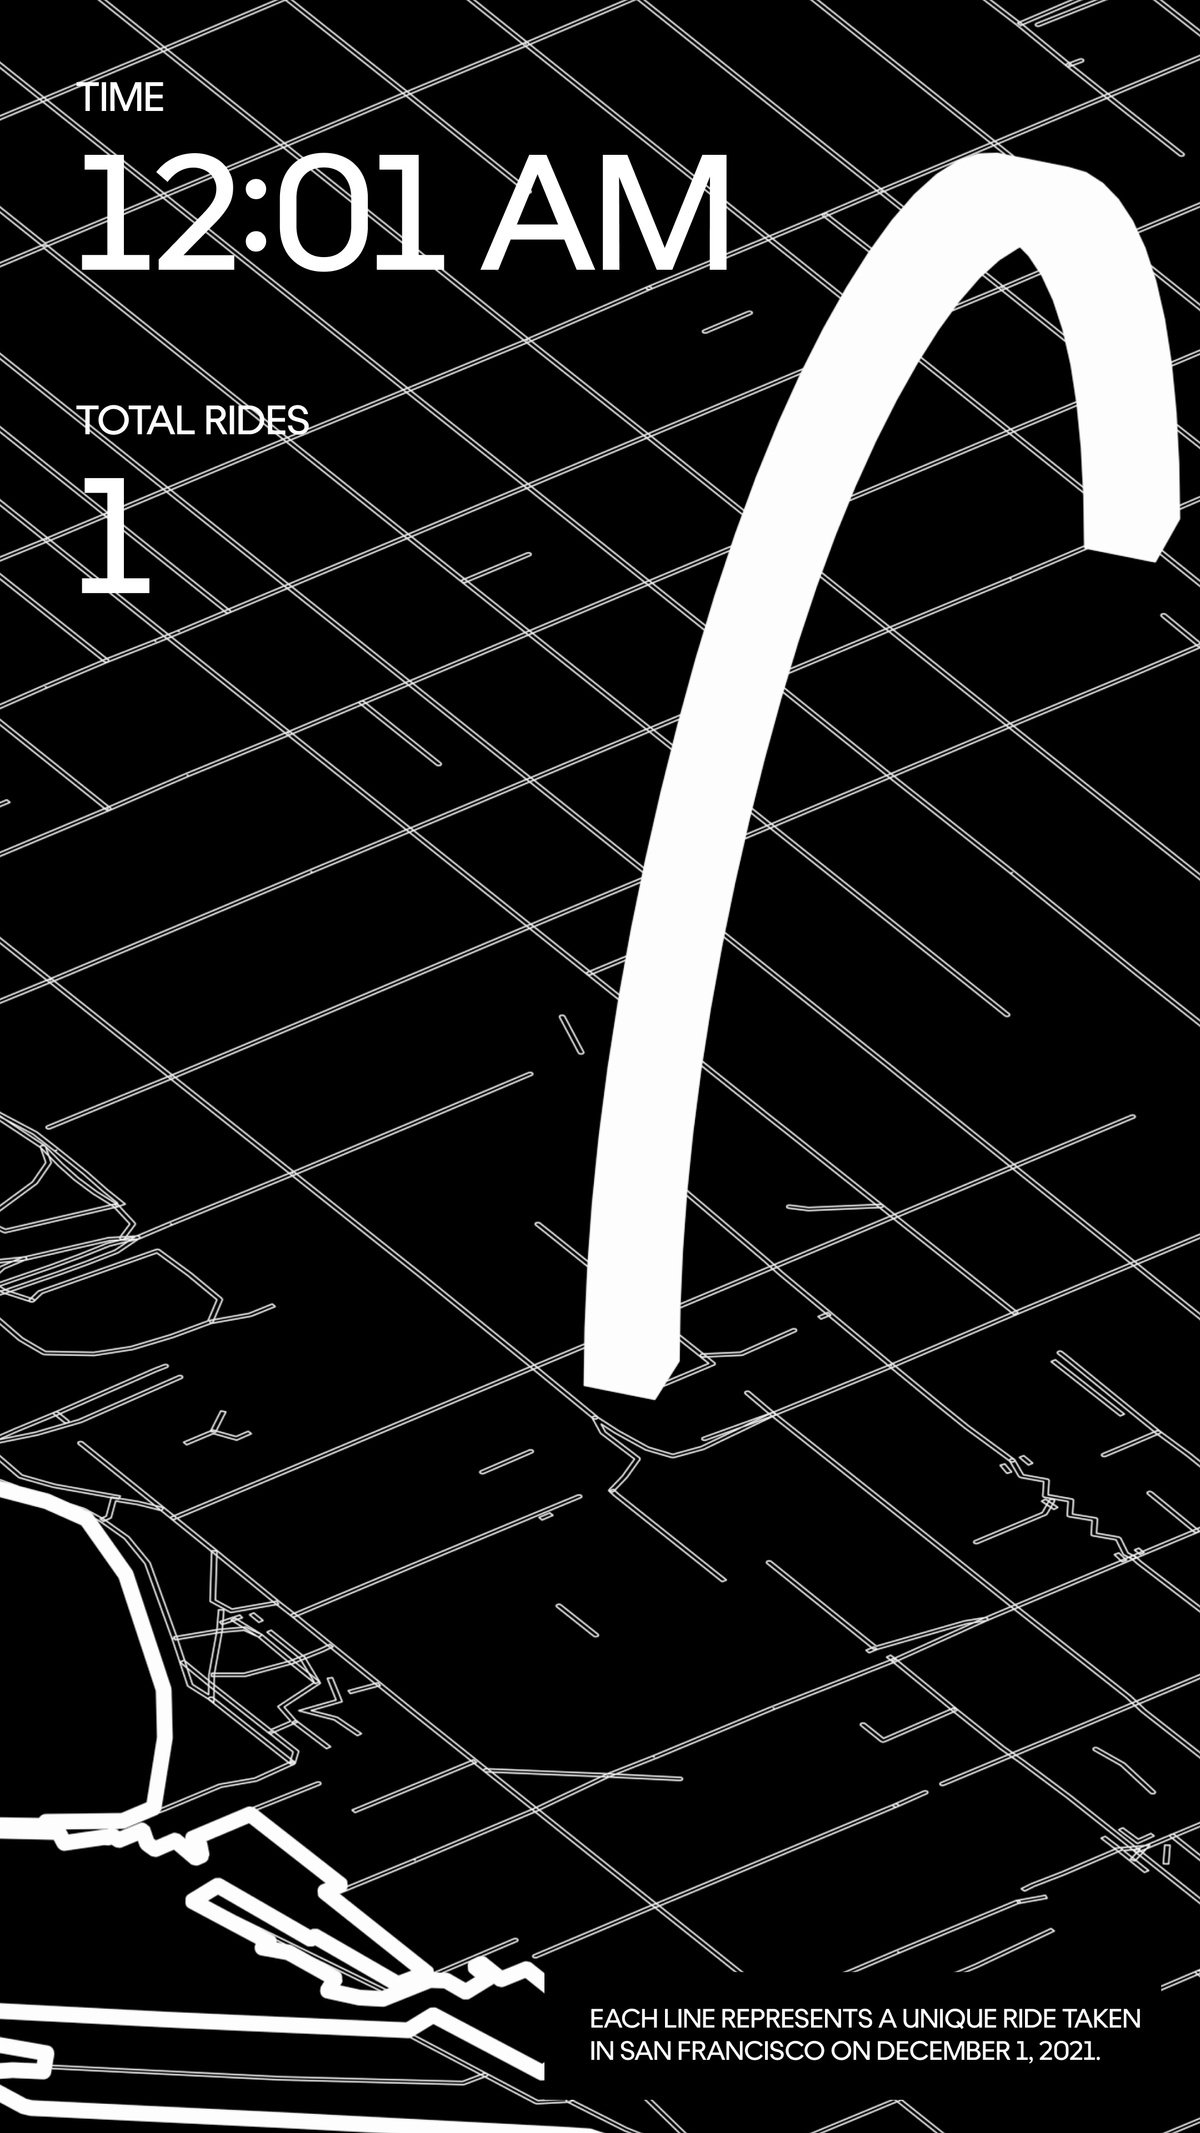
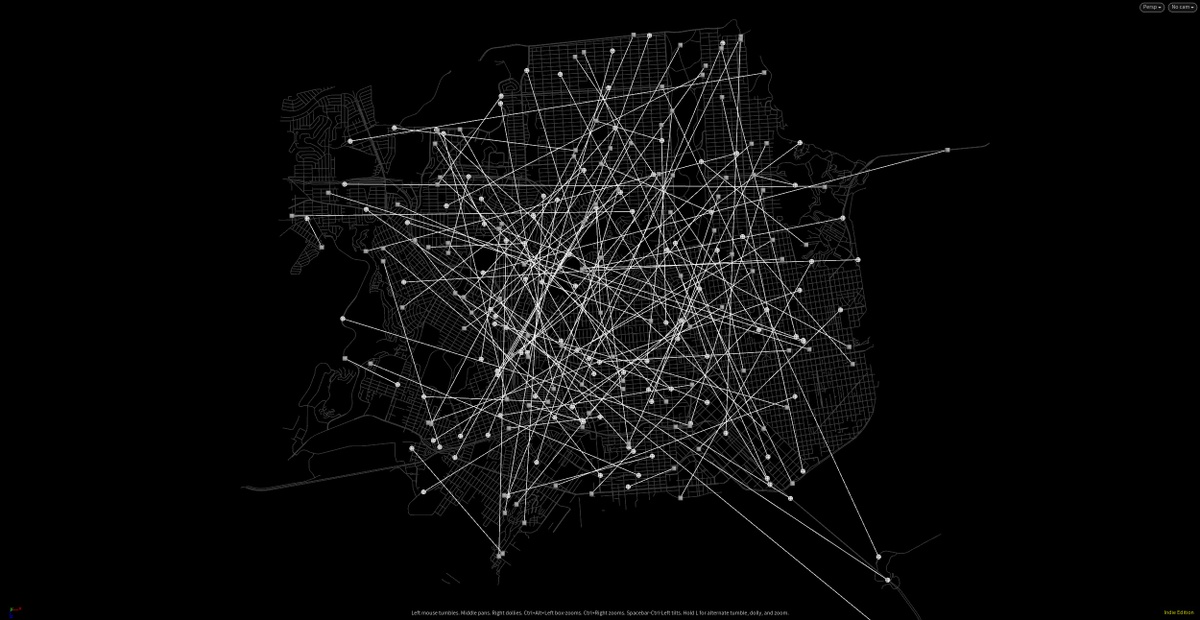
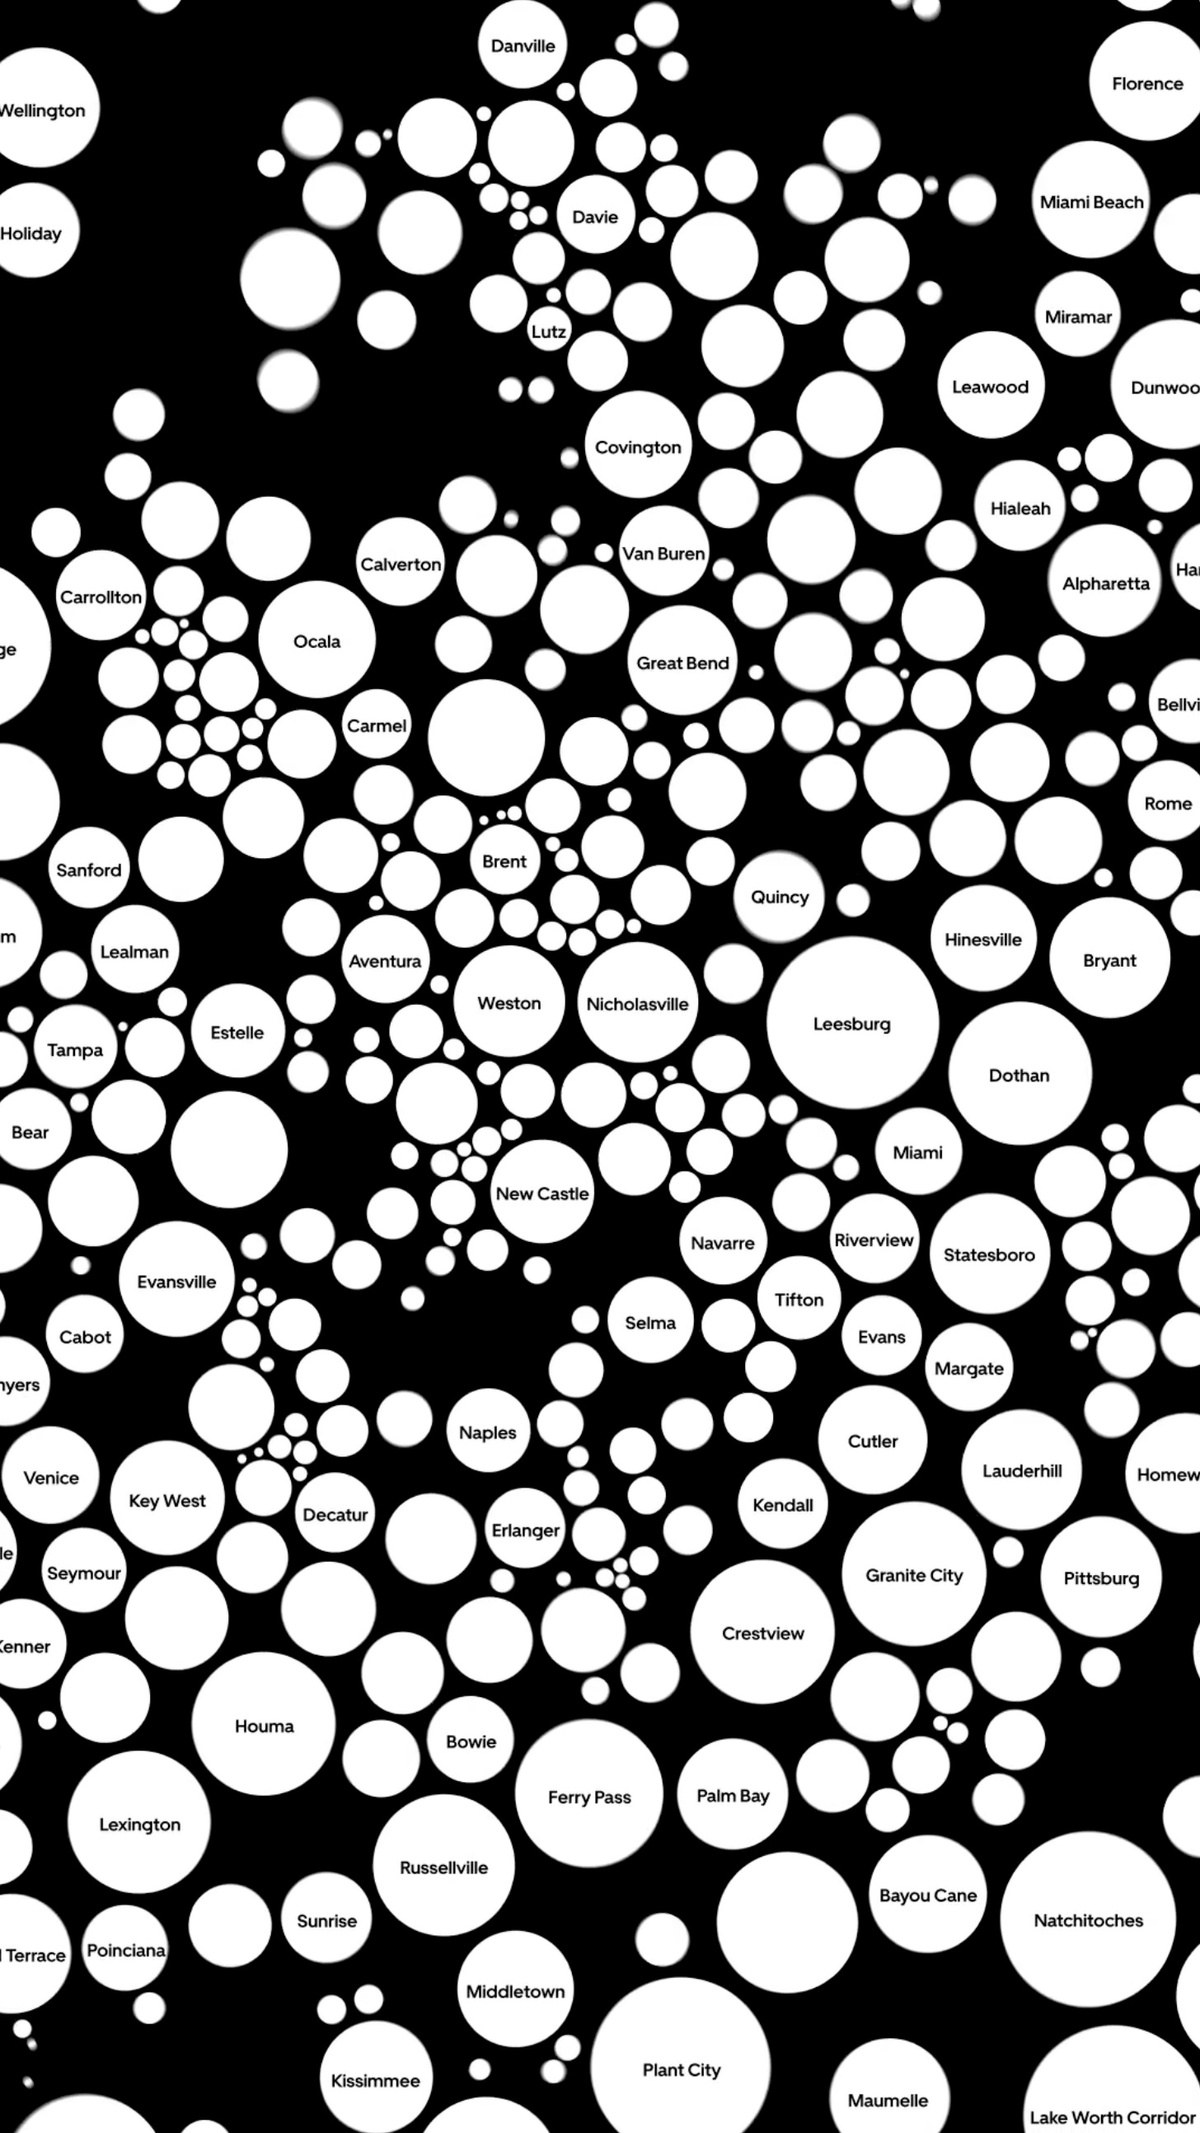
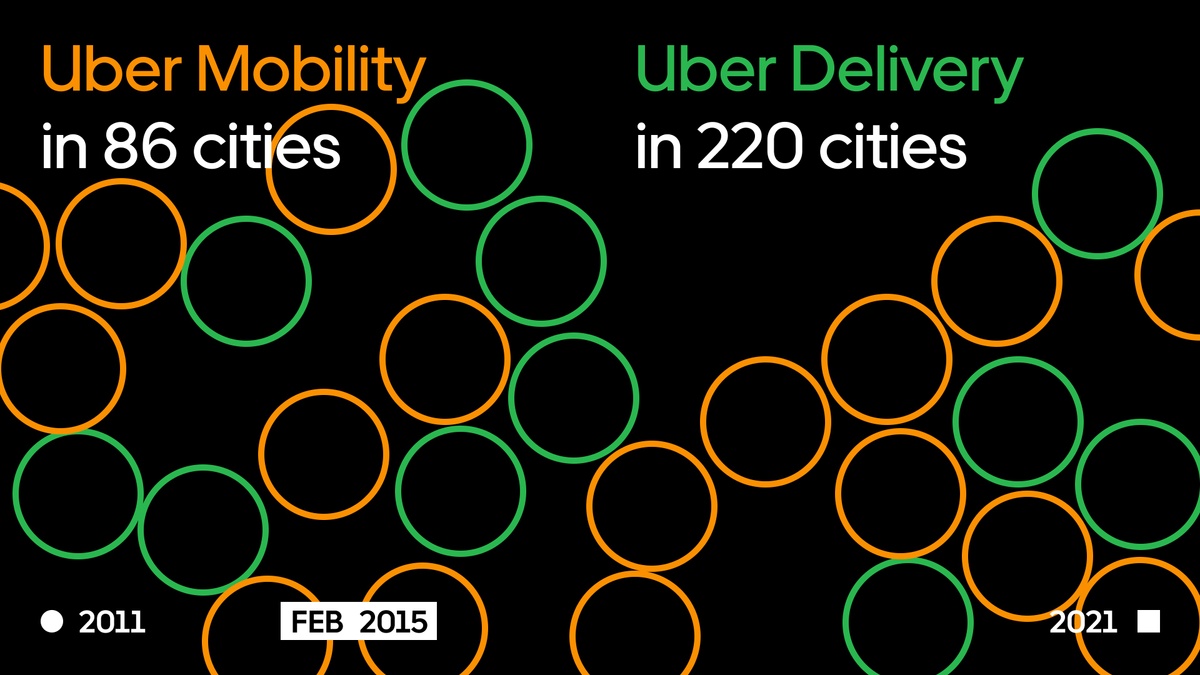
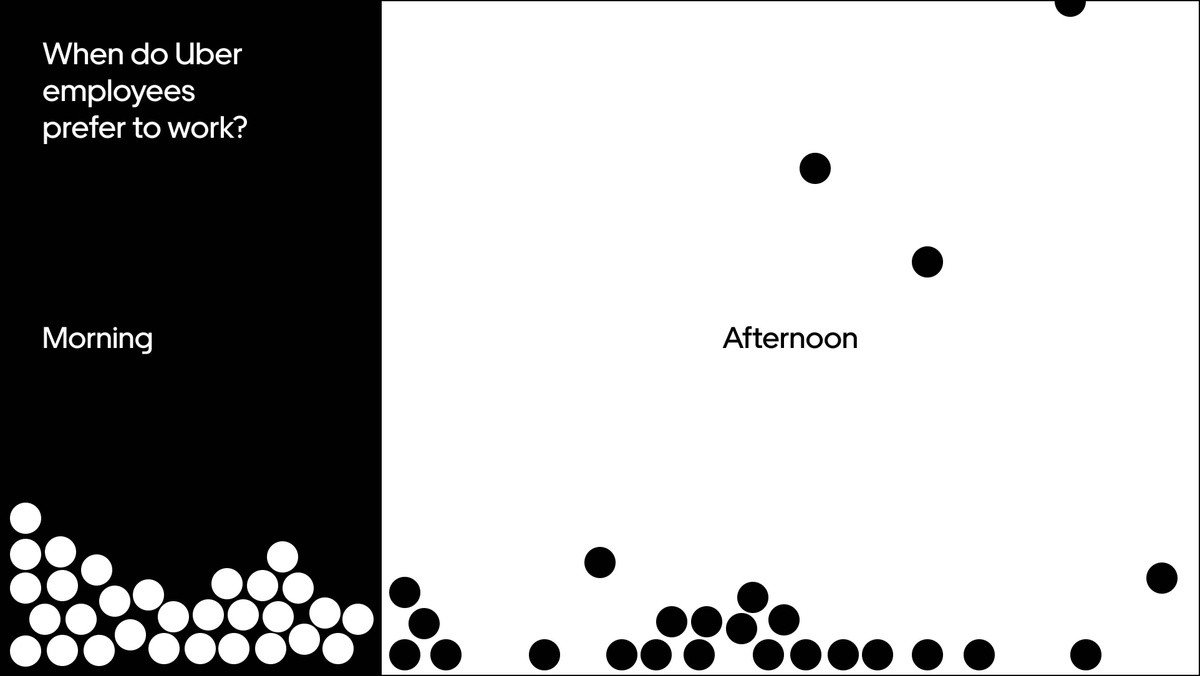
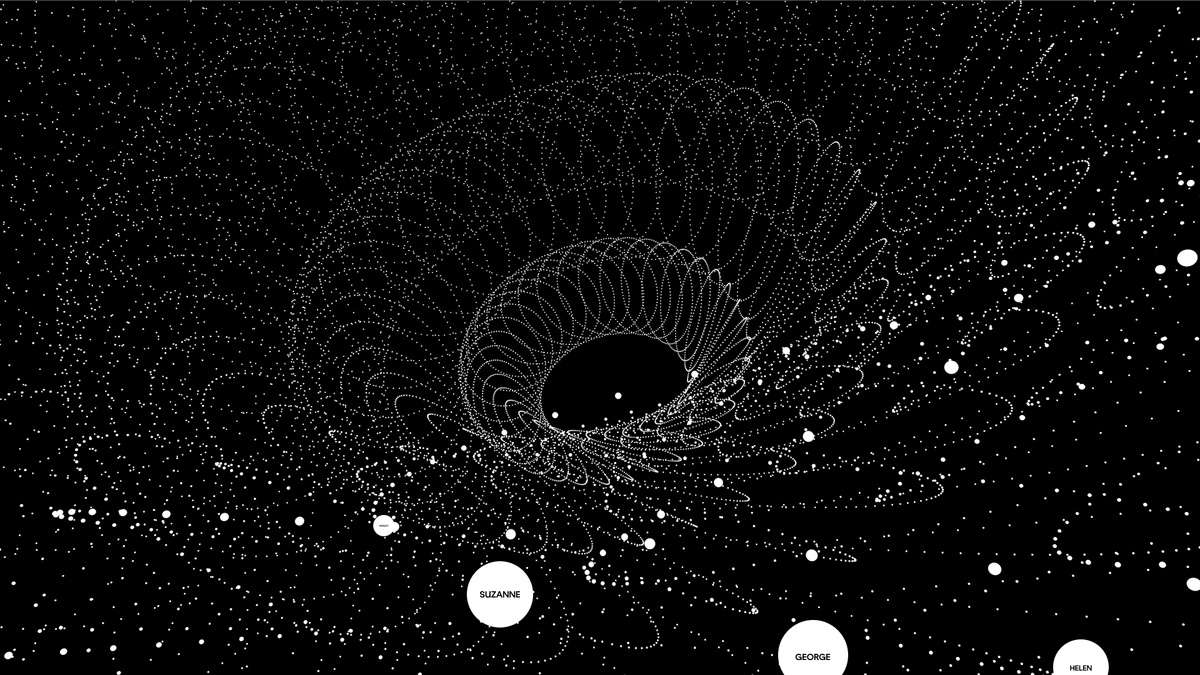
Our team worked with various Uber stakeholders to identify and mine relevant geographical, sentiment, behavioral, and product data to support the narratives at the center of Uber’s values. We developed a new suite of content that widens the brand system to accommodate data-driven storytelling, from mapping macro and micro geographical activities to juxtaposing employee preferences.
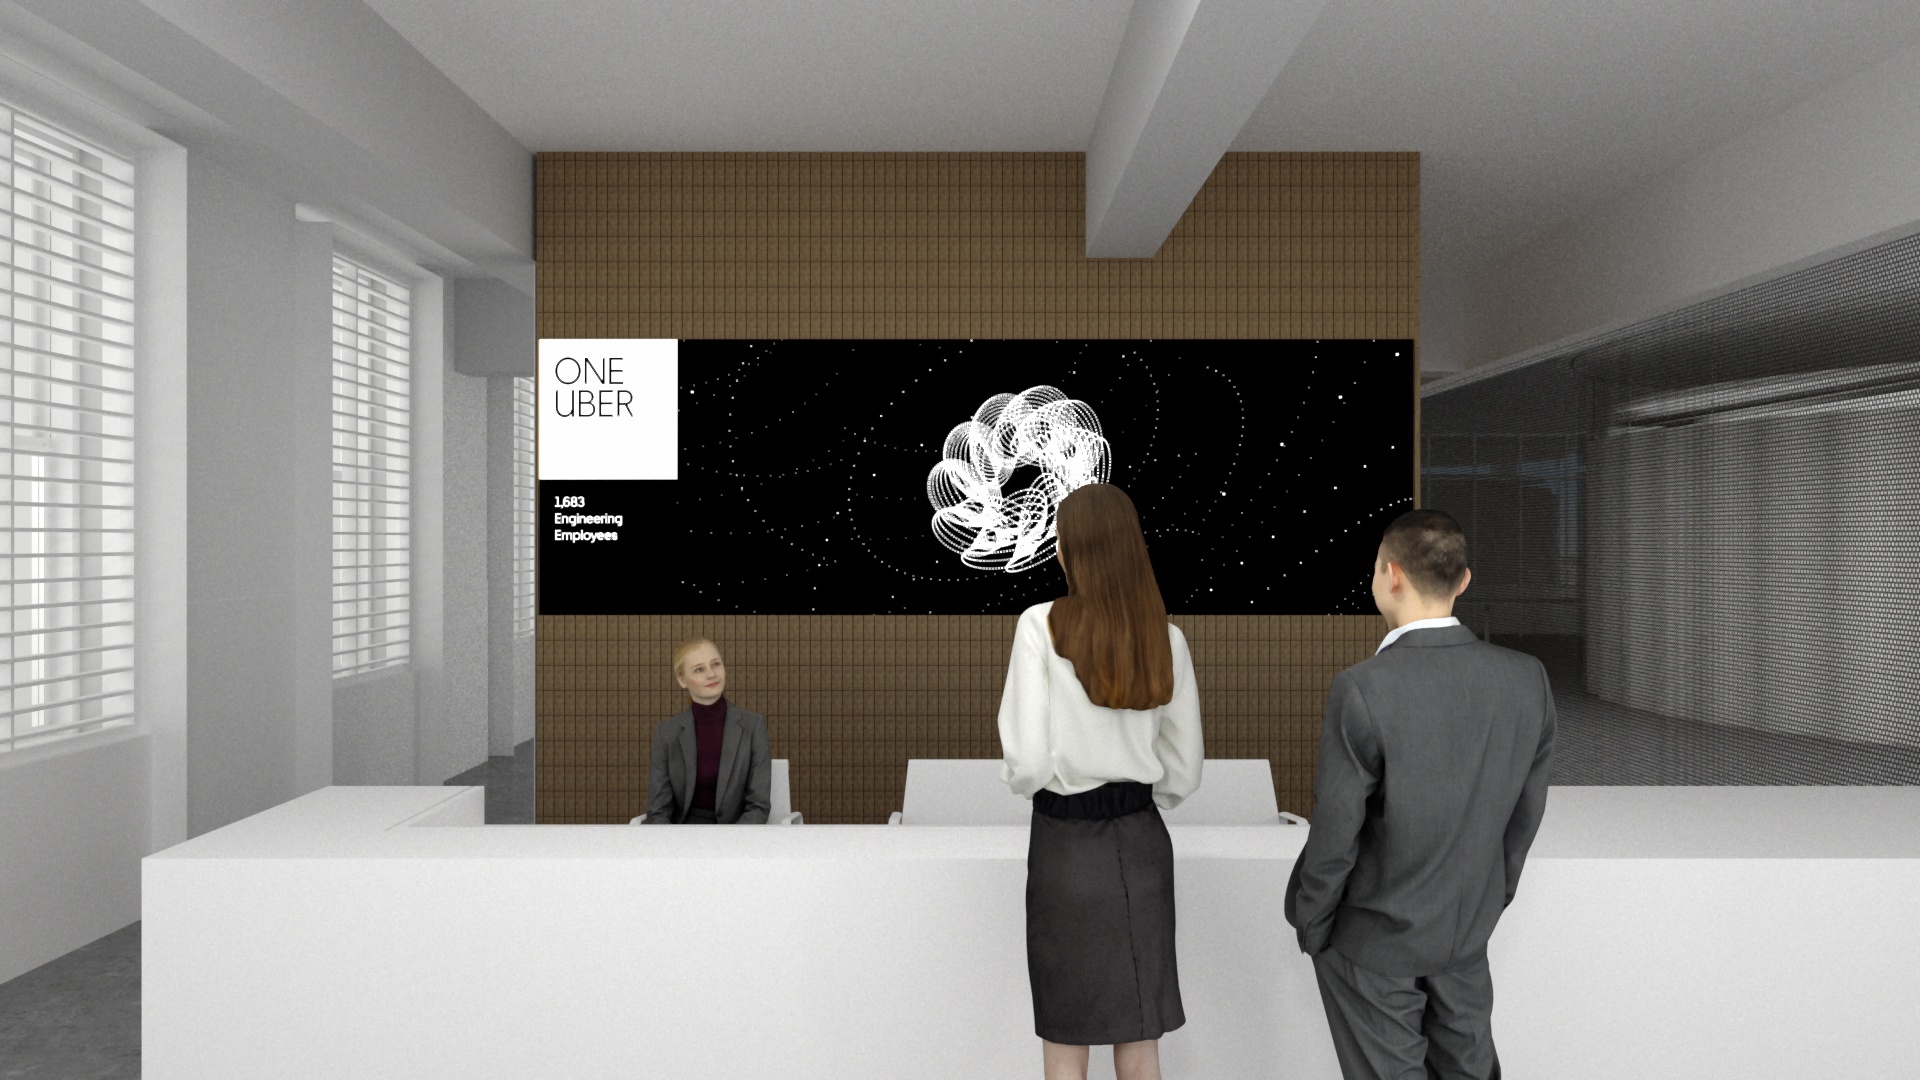
Creating Connection Among Uber’s Global Workforce
The final suite of digital content showcases motivational cultural beliefs supported by quantitative data insights. By integrating these visualizations into hundreds of environments around the world, Uber’s workforce achieves greater alignment around shared effort and impact–all by the numbers.